

In this post, we will discuss the output of a cash flow model using the cashflower package in Python. We will explore how to generate grouped output, select a subset of columns, and customise the output format. Understanding how to structure and manage output is essential for effective analysis and reporting. Whether you need aggregated projections or detailed individual results, this guide will walk through the key settings and provide practical examples.
Grouping
The output of a cash flow model is a table where rows represent periods and columns represent variables. The data represent the values of the variables for each period.
The structure of the output depends on the following settings:
- GROUP_BY - the grouping variable,
- OUTPUT_VARIABLES - list of output variables.
Let's see some examples.
Grouped by all
By default, the GROUP_BY setting is set to None. This configuration creates an aggregated output.
# settings.py
settings = {
    # ...
    GROUP_BY = None,
    # ...
}
Here is an example of the output..
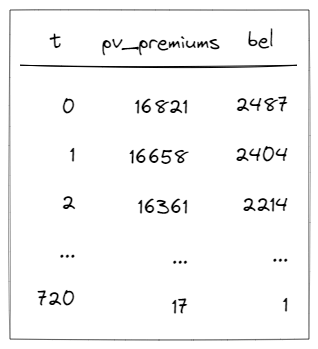
The results of the aggregated output are summed across all model points. There is only one set of projections, so the number of rows equals T_MAX_OUTPUT+1. The value is incremented by 1 because the projection starts at 0.
Grouped by attribute
You can also group results by a specific attribute, such as product.
# settings.py
settings = {
# ...
GROUP_BY = "product",
# ...
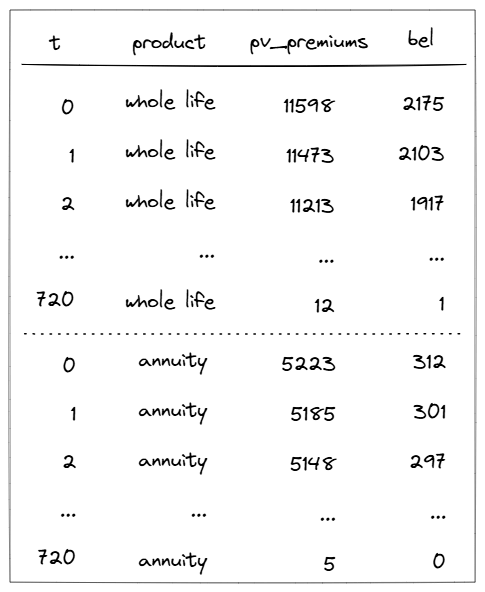
}To make this work, your model points must include a column named product:
# input.py
policy = ModelPointSet(data=pd.DataFrame({
    "product": ["whole_life", "annuity", "anuity", ..., "whole_life"],
    "premium": [100, 500, 200, ..., 75],
    # ...
}))
The model will sum values within each product group.
Individual output
You can create an individual output by setting GROUP_BY to a variable that differs for each row.
# settings.py
settings = {
    # ...
    GROUP_BY = "id",
    # ...
}
For example, if there's a column called id containing consecutive integers, this approach will ensure distinct groupings.
# input.py
policy = ModelPointSet(data=pd.DataFrame({
    "id": [1, 2, 3, ..., 100],
    "premium": [100, 500, 200, ..., 75],
    # ...
}))
Below, you can see an example of the output's structure.
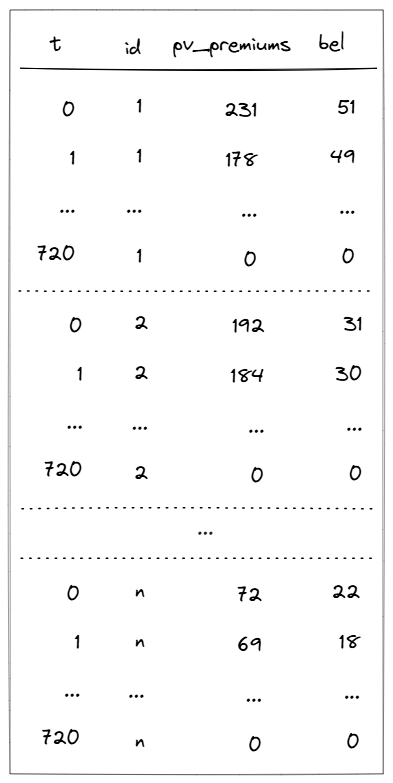
Each model point has its own set of results.
Subset of variables
If you don't need all model variables in your output, you can select a subset using the OUTPUT_VARIABLES setting.
By default, the OUTPUT_VARIABLES setting is set to None which creates output for all variables.
# settings.py
settings = {
    # ...
    OUTPUT_VARIABLES = None,
    # ...
}
You can choose a subset of columns by providing the list of variables' names.
# settings.py
settings = {
    # ...
    OUTPUT_VARIABLES = ["bel"],
    # ...
}
Here, only one variable has been selected for the output.
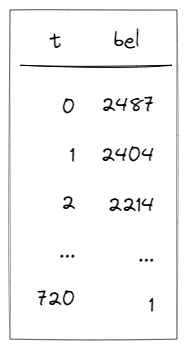
The output contains only the column bel.
Default vs custom output
Default output
By default, the results of the model are saved to files with comma-separated values. Files are saved in the output folder in the same directory as the model. The filename has the form: <timestamp>_output.csv (for example: 20231125_173512_output.csv).
The timestamp represents the moment when the model starts running. Timestamp is of the format YYYYMMDD_hhmmss, where:
- YYYY - year,
- MM - month,
- DD - day,
- hh - hours,
- mm - minutes,
- ss - seconds.
The model creates one output file per version.
Custom output
You can change the default output creation and adjust the model to save the results in your way. For example, you may want to save the results to other files or upload them to a database.
To use the custom output, follow these two steps.
Firstly, if you want to stop the model from saving the output in the default way, set the SAVE_OUTPUT setting to False.
# settings.py
settings = {
    # ...
    SAVE_OUTPUT = False,
    # ...
}
Now, the model will not save the output file on its own.
Secondly, adjust the code in the run.py script. In the script, you can find the following code:
# run.py
if __name__ == "__main__":
    output, _, _ = run(settings)
The output contains a data frame with results.
Let's say we do not want timestamps in the filenames and instead want to save the results as text files.
We can do it by adding the following line of code:
# run.py
output.to_string("my-awesome-results.txt")
Now, instead of output/<timestamp>_output.csv in the output folder, we will create the my-awesome-results.txt file in the main folder.
Thank you for reading the blog post and I hope you found it useful. Do you have any questions or topics to discuss? If so, please use the comment section below the post or the github repository.